
How to Look Up Rockingham County Jail Population Data
Population data for the Rockingham County jail does not sit in one tidy public dashboard. The most reliable local sources are the county's annual reports, budget documents, and PREA audit material. The county FY 2024 annual report carries Sheriff's Office operational figures. The Bureau of Justice Statistics publishes national and state jail trends that frame the county numbers. For a current figure not in those documents, a direct request to the Rockingham County Department of Corrections at 603-679-2244 is the right step.
The Bureau of Justice Statistics is the first-choice national source for jail trends. Its reports cover jail population, admissions, and pretrial share. The official BJS site is shown here:
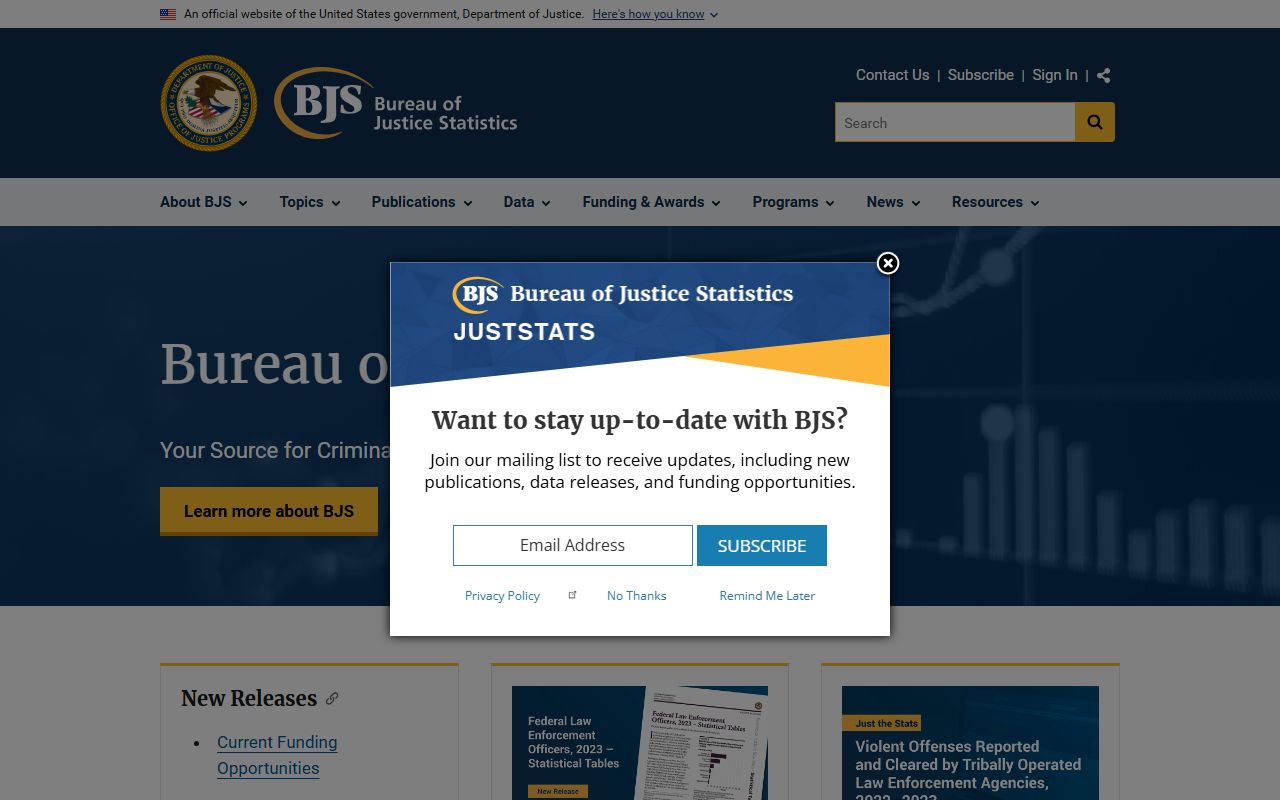
This page stays data-driven. It is not a how-to-search walkthrough. For a name lookup of a specific person, see the section near the end that points to the inmate records page.
Rockingham County Jail Capacity Overview
The county jail is the Rockingham County Department of Corrections at 99 North Road, Brentwood, NH 03833, phone 603-679-2244. A clean current capacity number was not located in the official sources reviewed. The county annual report and PREA audit material give operational context but not a published capacity table in accessible text. Where a figure is not confirmed, it is marked as not located rather than estimated.
| Facility | Address | Function | Capacity |
|---|---|---|---|
| Rockingham County Dept. of Corrections | 99 North Road, Brentwood, NH 03833 | County jail for pretrial and sentenced inmates; programming, medical, mental health | Not located in official sources |
To get an authoritative capacity and average daily population figure, a records request to the Department of Corrections or a review of the full annual report PDF is needed. Those documents may carry the average daily population, bookings, and average length of stay that the public web text does not.
Admissions and Audit Data
One firm local figure comes from a PREA audit. The audit material indicated 2,952 inmates were admitted to the facility in the prior 12-month audit period quoted. All admitted inmates received information about the zero-tolerance policy on sexual abuse and harassment and how to report it. Admissions count every booking, so the figure runs higher than the number of people held at any single moment.
Admissions and average daily population are different measures. A jail can admit thousands a year while holding a few hundred on any given day, because many bookings are short. Pretrial release, bail, diversion, and quick dispositions move people out fast. The admissions number is a flow measure. Average daily population is a snapshot measure.
What Drives the Rockingham County Jail Population
County jail population is shaped by arrests, pretrial detention, bail outcomes, charging decisions, probation violations, holds, court scheduling, and transfers to and from state prison. None of these acts alone. A change in one, like bail practice or court backlog, ripples through the others. The Sheriff's transport increase after the end of Felonies First shows how a procedural change can shift jail and court movement.
- Arrests and charging. Misdemeanor versus felony charging affects who is held.
- Pretrial detention and bail. Bail outcomes decide who waits in custody before trial.
- Probation and parole violations. A violation can return a person to custody.
- Holds and transfers. Out-of-state warrants, immigration detainers, and state-prison transfers all move people.
- Diversion and programs. The Adult Diversion Program can keep some people out of custody entirely.
Programs like Adult Diversion, STAR, Medication Assisted Treatment, and reentry case management may reduce return-to-custody over time, but official graduation and population-impact numbers were not located in the sources reviewed.
Pretrial vs Sentenced Population
Jails hold two broad groups. Pretrial detainees are awaiting trial and have not been convicted of the charge that holds them. Sentenced inmates are serving a county term after conviction. A confirmed Rockingham County pretrial-to-sentenced split was not located in accessible official sources, so the table below frames the comparison and marks the county figures as needing a records request.
| Pretrial | Sentenced | |
|---|---|---|
| Status | Awaiting trial; not convicted of the holding charge | Convicted; serving a county term |
| Driver | Bail, charge severity, flight or safety risk | Sentence length, program completion |
| County figure | Not located; request from DOC | Not located; request from DOC |
Nationally, a large share of local jail populations are pretrial rather than sentenced, which is one reason bail policy is so closely watched. The BJS reports give the national pretrial share for comparison.
Demographic Breakdown of the Jail Population
A confirmed demographic breakdown for the Rockingham County jail, by age, sex, or race, was not located in accessible official sources during this research pass. County jails generally hold more men than women and a working-age adult majority, but a published Rockingham table is needed to state local figures. A records request to the Department of Corrections or the full annual report is the way to get an authoritative breakdown.
The misdemeanor-versus-felony mix also shapes the population. Felony defendants tend to be held longer, so they make up a larger share of the average daily count than of total bookings. Misdemeanor and violation cases often resolve fast, so they drive admissions more than the daily snapshot. Without a published county table, both shares are marked as needing a records request rather than estimated here.
Mental Health and Substance Use Population
The Rockingham County jail staffs Licensed Clinical Mental Health Counselors, Master Licensed Drug and Alcohol Counselors, and Licensed Drug and Alcohol Counselors. That staffing reflects a population with significant mental-health and substance-use needs, a pattern common in county jails nationwide. Programs include STAR, Medication Assisted Treatment, AA/NA, SMART Recovery, Peer Recovery with SOS Recovery, Trauma Group, and Anger Management.
These services connect the population picture to outcomes. A jail that treats substance use and mental health may see different return-to-custody patterns than one that does not. Specific treatment-population counts were not located in official sources, so the programming list is the verified local detail, not a demographic count.
National and State Jail Context
County numbers read better against state and national figures. Use the Bureau of Justice Statistics first for official jail population and incarceration-rate data. Research institutes add context: the Prison Policy Initiative publishes New Hampshire incarceration analysis, and the Vera Institute publishes county-level trend work. These research sources are not government data, so they should be labeled as research analysis rather than official county figures.
| Rate per 100,000 | Source | Notes |
|---|---|---|
| County rate | BJS / DOC records request | County-specific; request if not in annual report. |
| State rate | BJS | New Hampshire statewide jail and prison figures. |
| National rate | BJS | U.S. jail incarceration rate for comparison. |
Mark clearly which numbers are county-specific and which are state or national. Mixing them produces a misleading picture, which is why this page keeps the county figures separate and flags the gaps.
Population Trends Over Time
A complete official five-year average daily population, capacity, and demographic trend was not located in accessible official sources during this research pass. Several operational indicators from the FY 2024 annual report still describe the system around the jail. Sheriff transports rose more than 18% over the prior year, partly due to the December 2023 end of the Felonies First Program. The Patrol and Civil Division processed an average of 581 court-issued writs per month for the county's towns.
The Communications Center logged 222,564 calls, the first decrease in sixteen years. The Warrants and Investigations Divisions investigated 160 criminal cases and conducted out-of-state extraditions. These are operational measures, not jail-population counts, but they describe the activity that feeds the jail. A transport increase, for example, does not by itself prove more crime, more bookings, or more convictions; it reflects a process change.
Searching for a Rockingham County Inmate by Name
This page covers population data, not individual records. To look up a specific person, custody status, or release, use the Rockingham County inmate records page. The county does not publish a public jail roster, so name lookups run through a call to 603-679-2244, VINE notifications, and the state and federal locators. The population numbers here are about the system as a whole, not any one person.
Where the Data Comes From
The verified local figures on this page come from the county FY 2024 annual report and PREA audit material. National and state context comes from the Bureau of Justice Statistics, with research analysis from the Prison Policy Initiative and the Vera Institute clearly labeled as non-government sources. Where a county-specific number was not located, this page says so rather than estimating. For the most current capacity and average daily population, file a records request with the Department of Corrections or review the full annual report. A Right-to-Know request under RSA 91-A is the formal route for county records that are not posted online, and the county publishes a Right-to-Know request form for that purpose.